
Documentation
From expression to picture.
Compare curves, explore a surface, and adjust the view without leaving the calculator.
Plot a pair of curves
Type this expression in the calculator. The live graph appears below the result and changes with the expression.
- Use bare x for the horizontal coordinate. Saved variables and custom function names still require $.
- The screenshot narrows the Y range so the sine and cosine curves are easy to compare.
plot(sin(x), cos(x))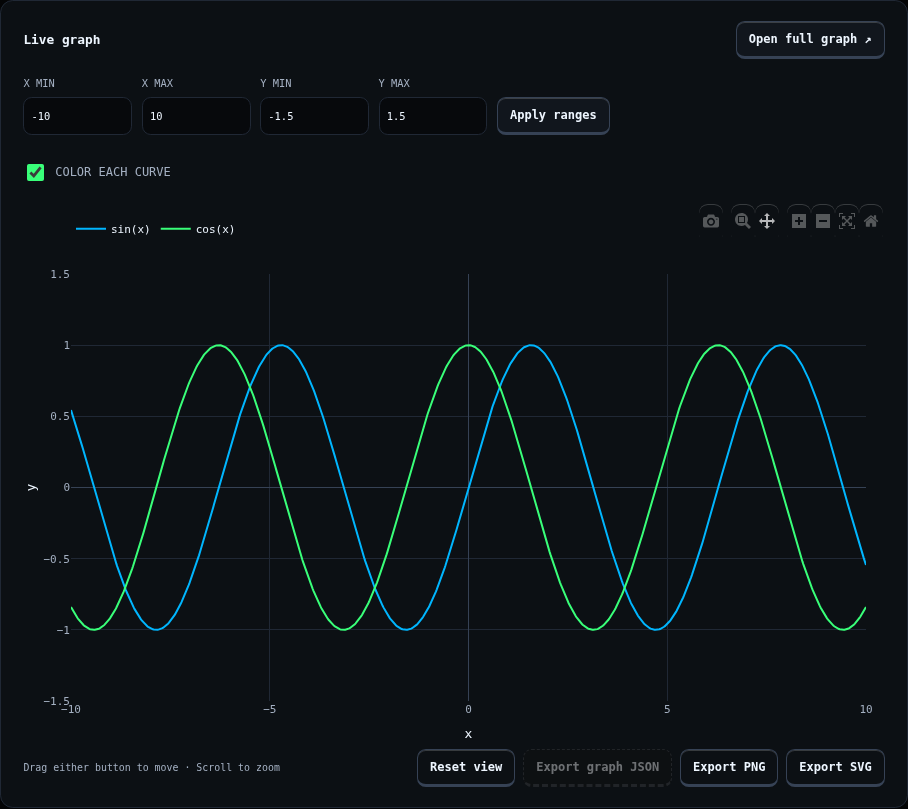
Give the graph room
Choose Open full graph to inspect it in a larger view. Drag to pan, use the graph’s zoom controls, or set explicit minimum and maximum ranges.
- Adjust X and Y ranges, then apply them.
- Enable separate colors when comparing curves.
- Reset the view if a pan or zoom takes you away from the interesting part.
Plot a custom function
Save a function with a $ prefix, then use the same name in a plot expression. Its parameter is local to the definition; x is the graph coordinate in the plot.
$wave(t) = sin(t)
plot($wave(x))Explore 3D
Type a surface expression using bare x and y coordinates. The live 3D view updates as the expression changes.
- Left-drag to rotate the surface; right-drag to pan.
- Scroll to zoom. Adjust X and Y ranges, then choose Apply ranges.
- Use Reset view to return to the default view.
plot3d(sin(x) * cos(y))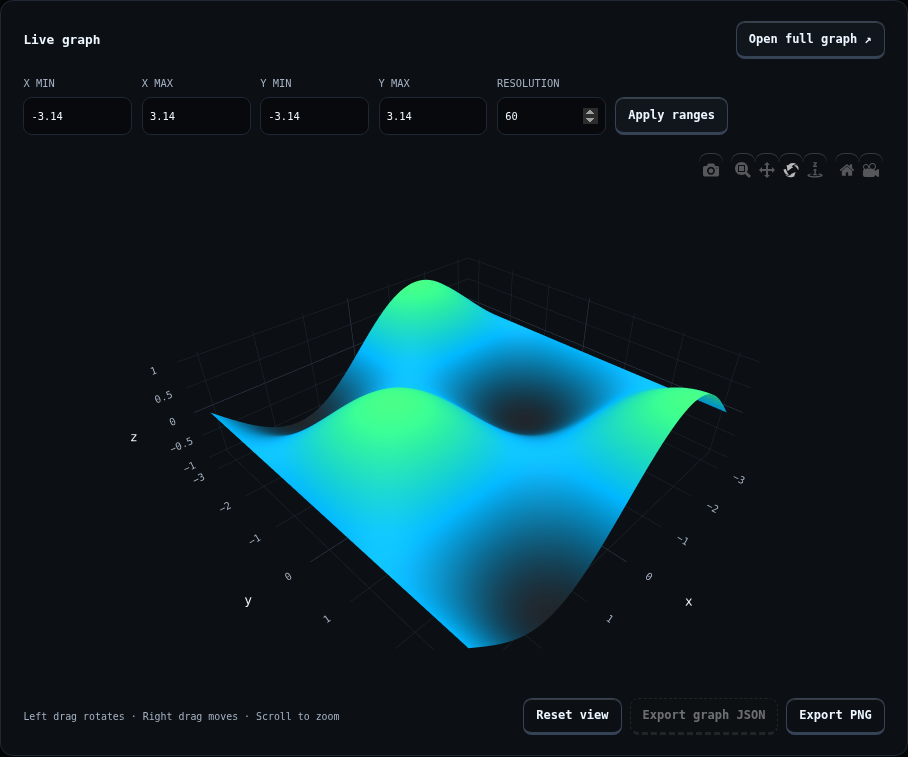
Keep the result
Use the graph export controls to save an image. Workspace exports also preserve saved graph definitions, so the expression can be reused later.